

The Sahm Rule Recession Indicator has declined for nine consecutive months since December 2025, falling to -0.07 percentage points in August 2026, according to data published by the Federal Reserve Bank of St. Louis. The indicator, developed by economist Claudia Sahm, peaked at 0.57 percentage points in August 2024 and has now turned negative for the first time since July 2026. The steady descent marks a significant reversal from the mid-2024 period when the measure approached recessionary territory.
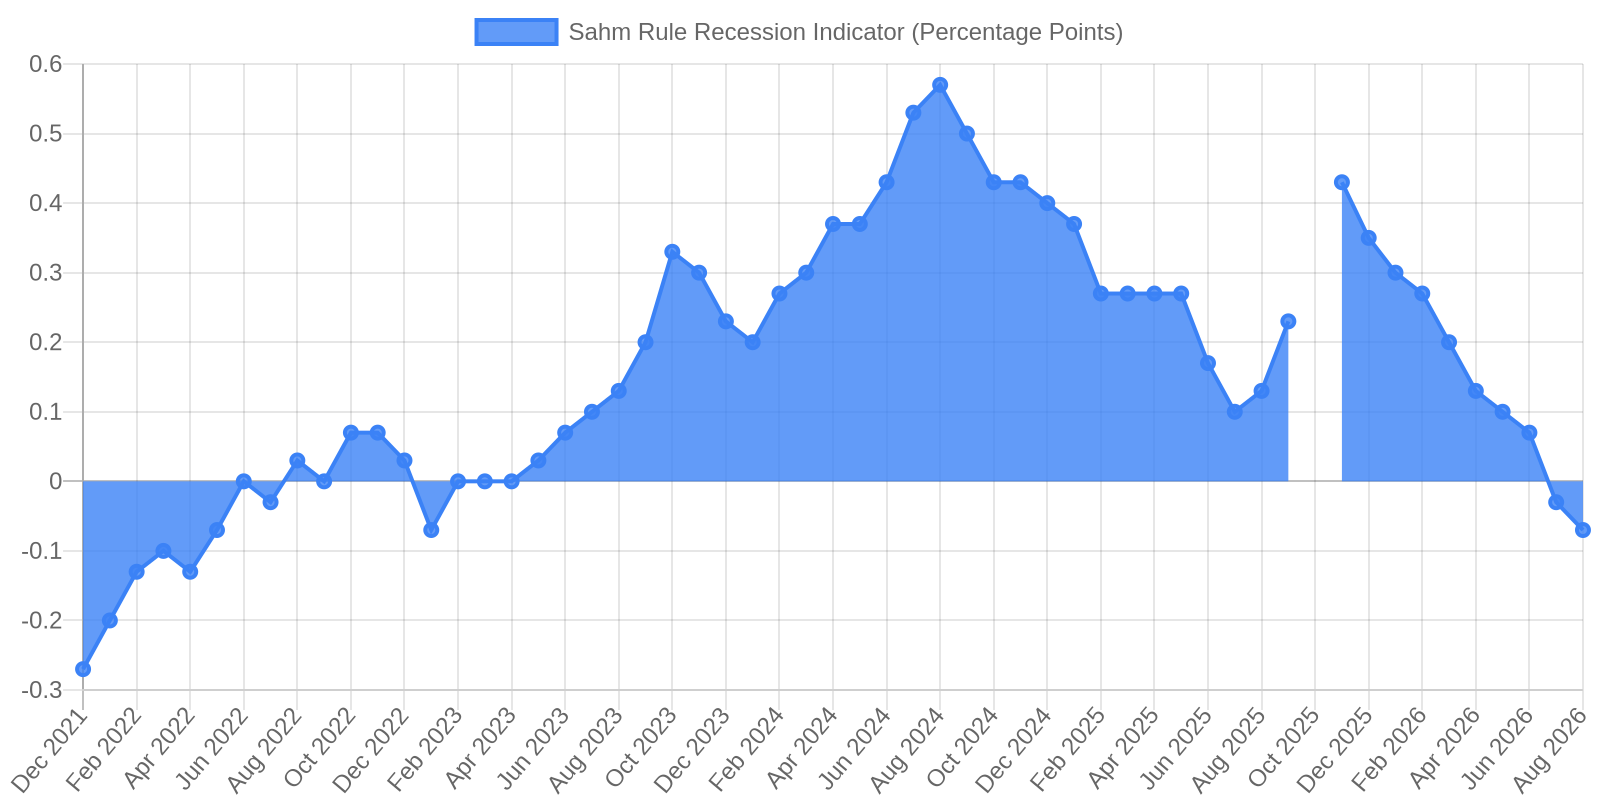
The Sahm Rule Recession Indicator declined from a peak of 0.57 percentage points in August 2024 to -0.07 in August 2026, reflecting nine consecutive months of decline since December 2025.
The data shows the indicator's dramatic trajectory over the past five years. From December 2021, when it stood at -0.27 percentage points, the measure climbed steadily through 2023 and into 2024, reaching its high of 0.57 percentage points in August 2024. The indicator remained elevated through the end of 2024, hovering between 0.40 and 0.43 percentage points from October through December. Starting in January 2025, the measure began retreating, dropping from 0.37 percentage points to 0.27 by February 2025 and continuing its decline through the spring and summer. By June 2025, it had fallen to 0.17 percentage points, then to 0.10 in July before rebounding slightly to 0.23 in September. The downward trend resumed in earnest from November 2025, when the indicator registered 0.43 percentage points, falling month after month to 0.35 in December, 0.30 in January 2026, and continuing through 0.27, 0.20, 0.13, 0.10, and 0.07 in subsequent months before finally crossing into negative territory at -0.03 in July 2026 and reaching -0.07 by August 2026.
The Sahm Rule signals recession when the three-month moving average of national unemployment rises by 0.50 percentage points or more compared to the lowest three-month average from the prior 12 months, according to the report's methodology notes. The indicator is calculated using "real-time" data, meaning it reflects the unemployment rate and recent unemployment history available in any given month. The Bureau of Labor Statistics revises the unemployment rate each January when December's prior-year data is published, and changes to seasonal adjustment factors can affect recent-year estimates, though the unemployment rate itself doesn't otherwise revise.
The indicator's fall below zero suggests labor market conditions have strengthened rather than weakened over the measured period. When the Sahm Rule registers negative values, it means the recent three-month unemployment average has dropped relative to the previous year's low point, pointing to tightening rather than loosening employment conditions. The nine-month decline from December 2025 through August 2026 represents the longest sustained decrease since the indicator began falling from its 2024 peak. While the measure came close to the 0.50 threshold in mid-2024—rising to 0.57 and staying above 0.40 for several months—it never triggered a formal recession signal and has since retreated significantly.
The latest reading indicates recession risk has diminished considerably from 2024 levels, with the labor market showing resilience through the first eight months of 2026. The continuous monthly declines since late 2025 suggest unemployment trends have improved steadily, reversing the earlier pattern of rising joblessness that pushed the indicator upward through 2023 and 2024. For policymakers and market watchers, the negative reading offers reassurance that the employment picture has stabilized and improved, moving further from recessionary conditions with each passing month.